# PlotNeuralNet
[](https://doi.org/10.5281/zenodo.2526396)
Latex code for drawing neural networks for reports and presentation. Have a look into examples to see how they are made. Additionally, lets consolidate any improvements that you make and fix any bugs to help more people with this code.
## TODO
- [X] Python interfaz
- [ ] Pytorch generate graph arquiture
- [ ] Add easy legend functionality
- [ ] Add more layer shapes like TruncatedPyramid, 2DSheet etc
## Usage
mkdir my_project
cd my_project
vim my_arch.py
import sys
sys.path.append('../')
from core.tikzeng import *
# defined your arch
arch = [
to_head( '..' ),
to_cor(),
to_begin(),
to_Conv( 'conv1', 572, 64, offset="(0,0,0)", to="(0,0,0)" ),
to_Pool("pool1", offset="(0,0,0)", to="(conv1-east)"),
to_SoftMax( "soft1", "SOFT", 10 ,"(3,0,0)", "(pool1-east)" ),
to_connection( "pool1", "soft1"),
to_end()
]
def main():
namefile = str(sys.argv[0]).split('.')[0]
to_generate(arch, namefile + '.tex' )
if __name__ == '__main__':
main()
bash ../tikzmake.sh my_arch
## Examples
Following are some network representations:
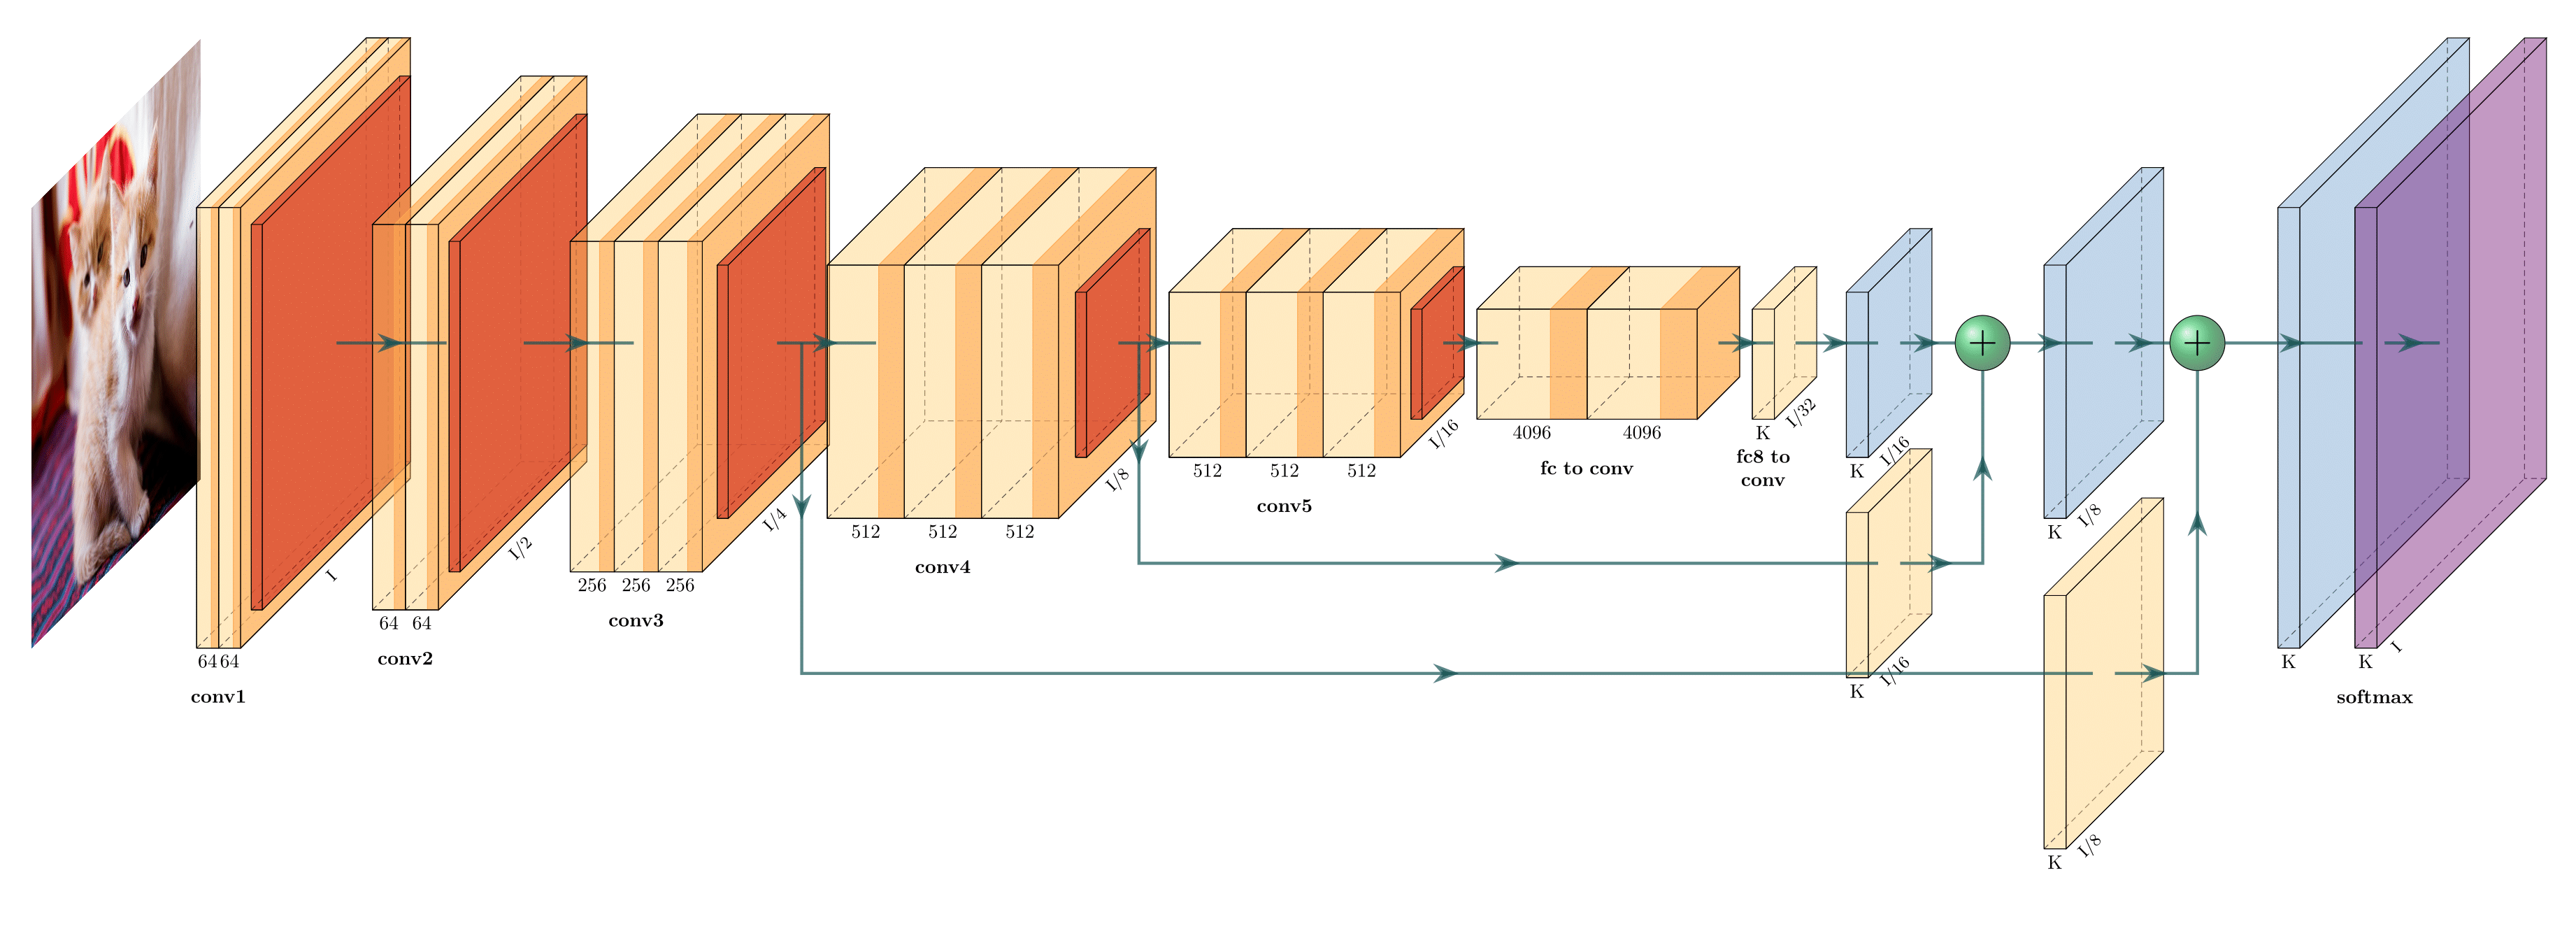
FCN-8
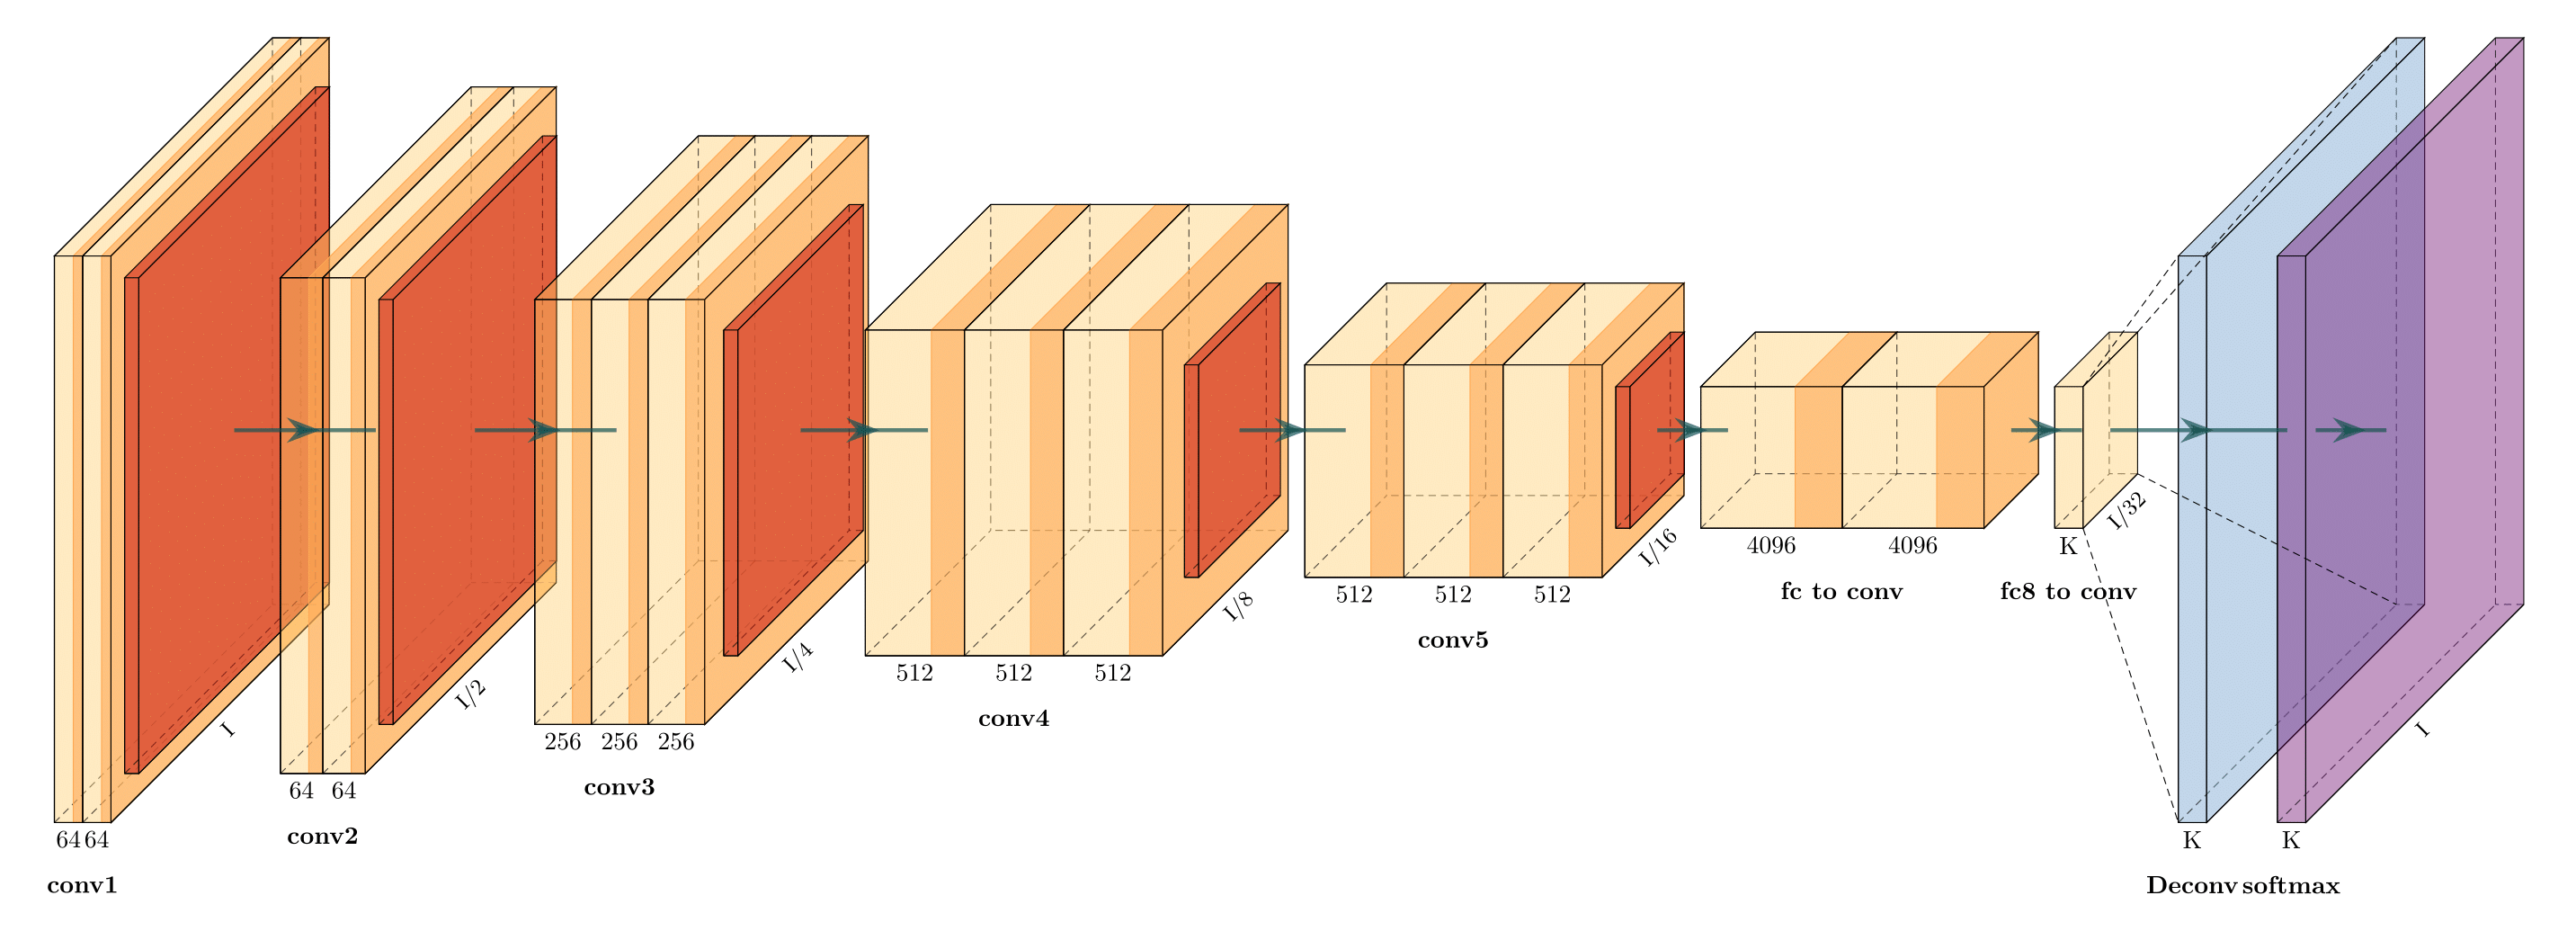
VGG16

Holistically-Nested Edge Detection